Portfolio

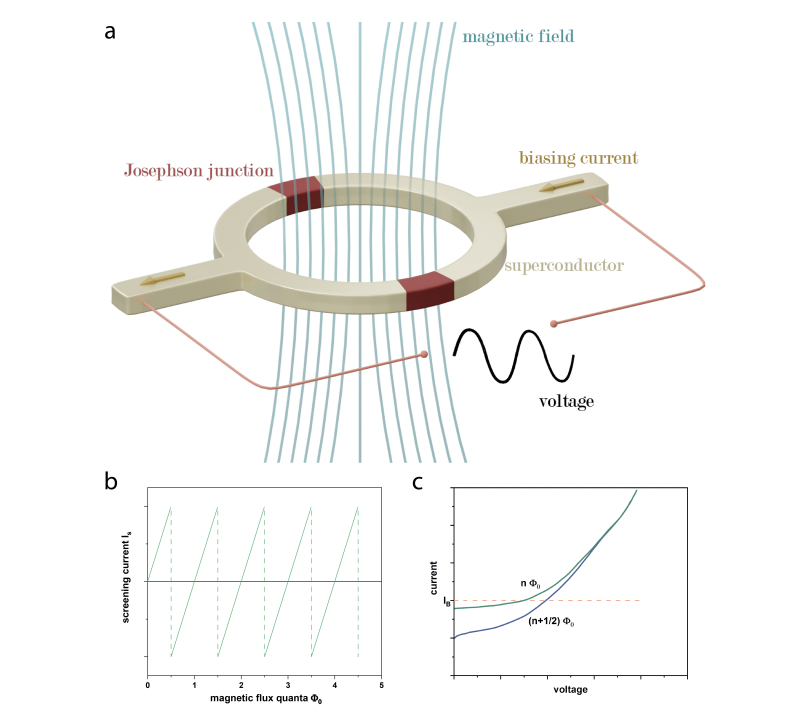
This is a small selection of my 3D renders in Blender, soil science projects, and data science and illustration work.

Have fun exploring!
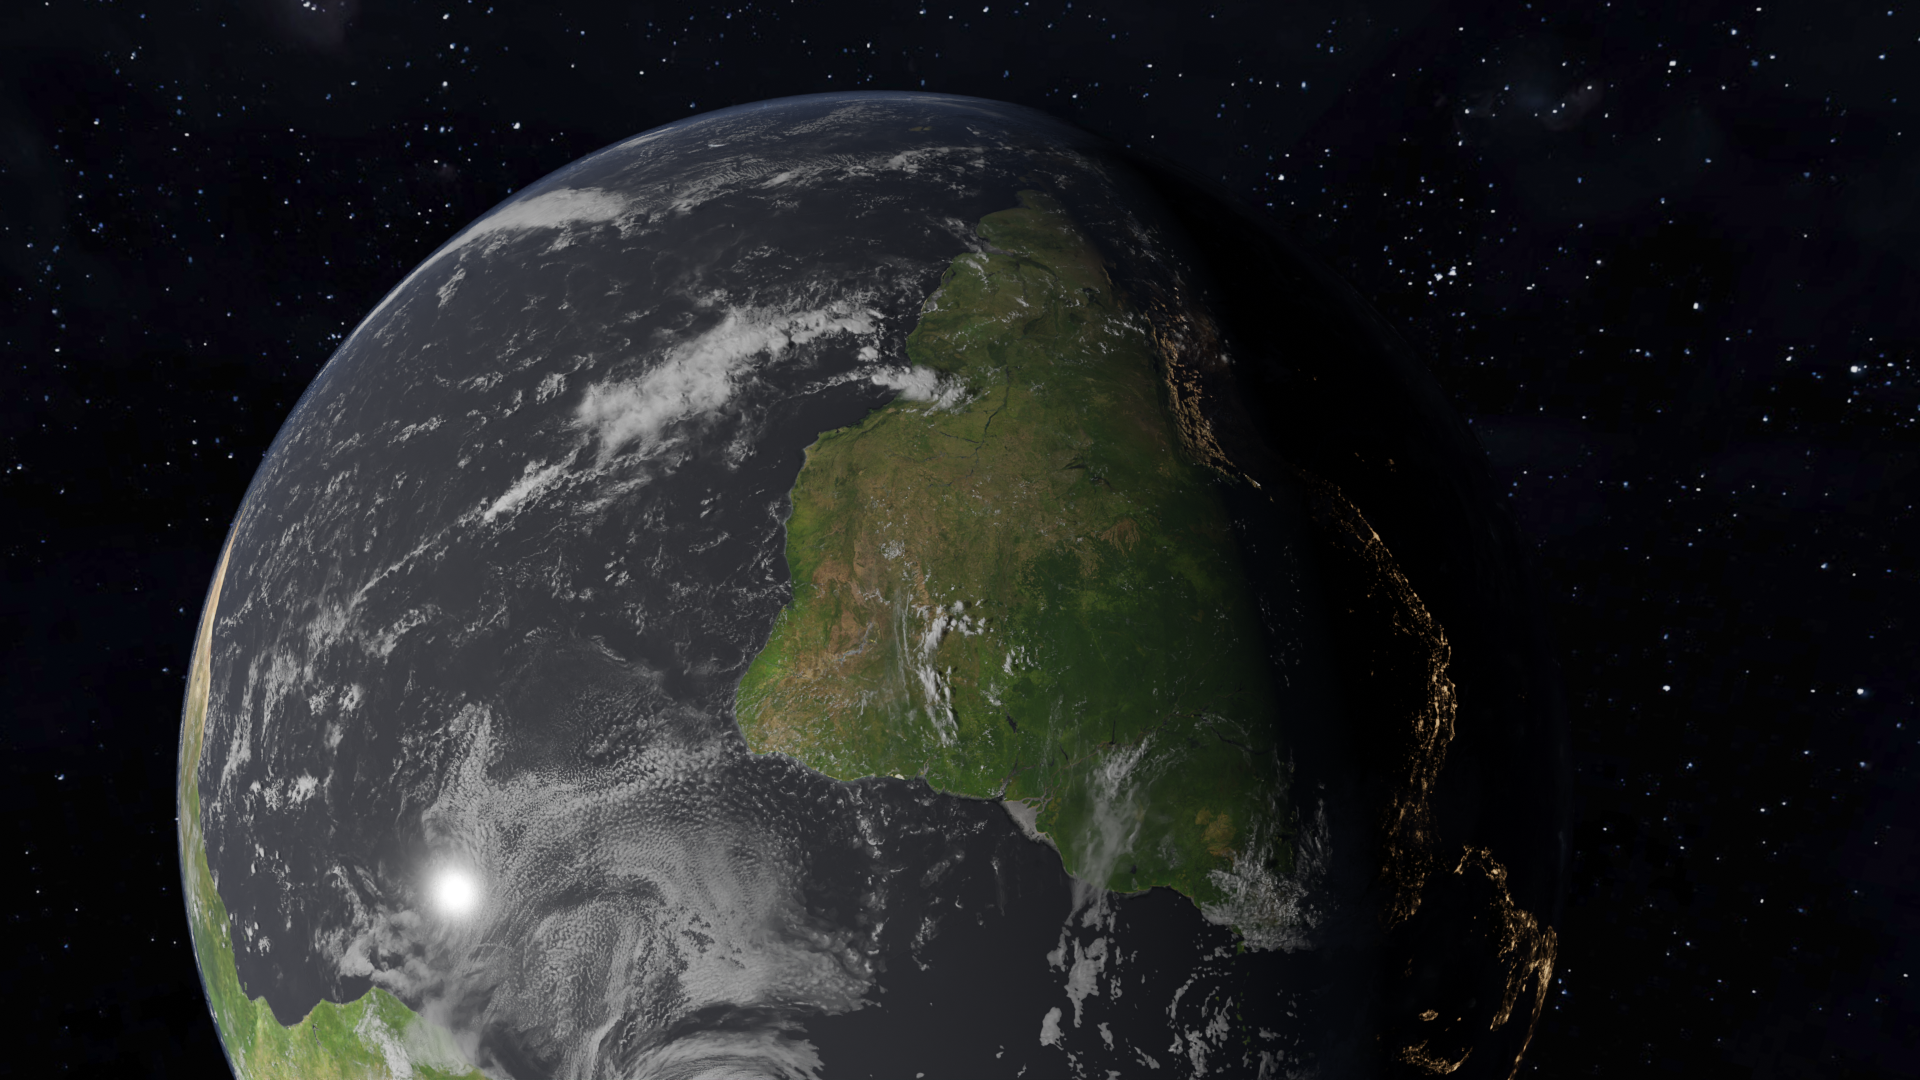
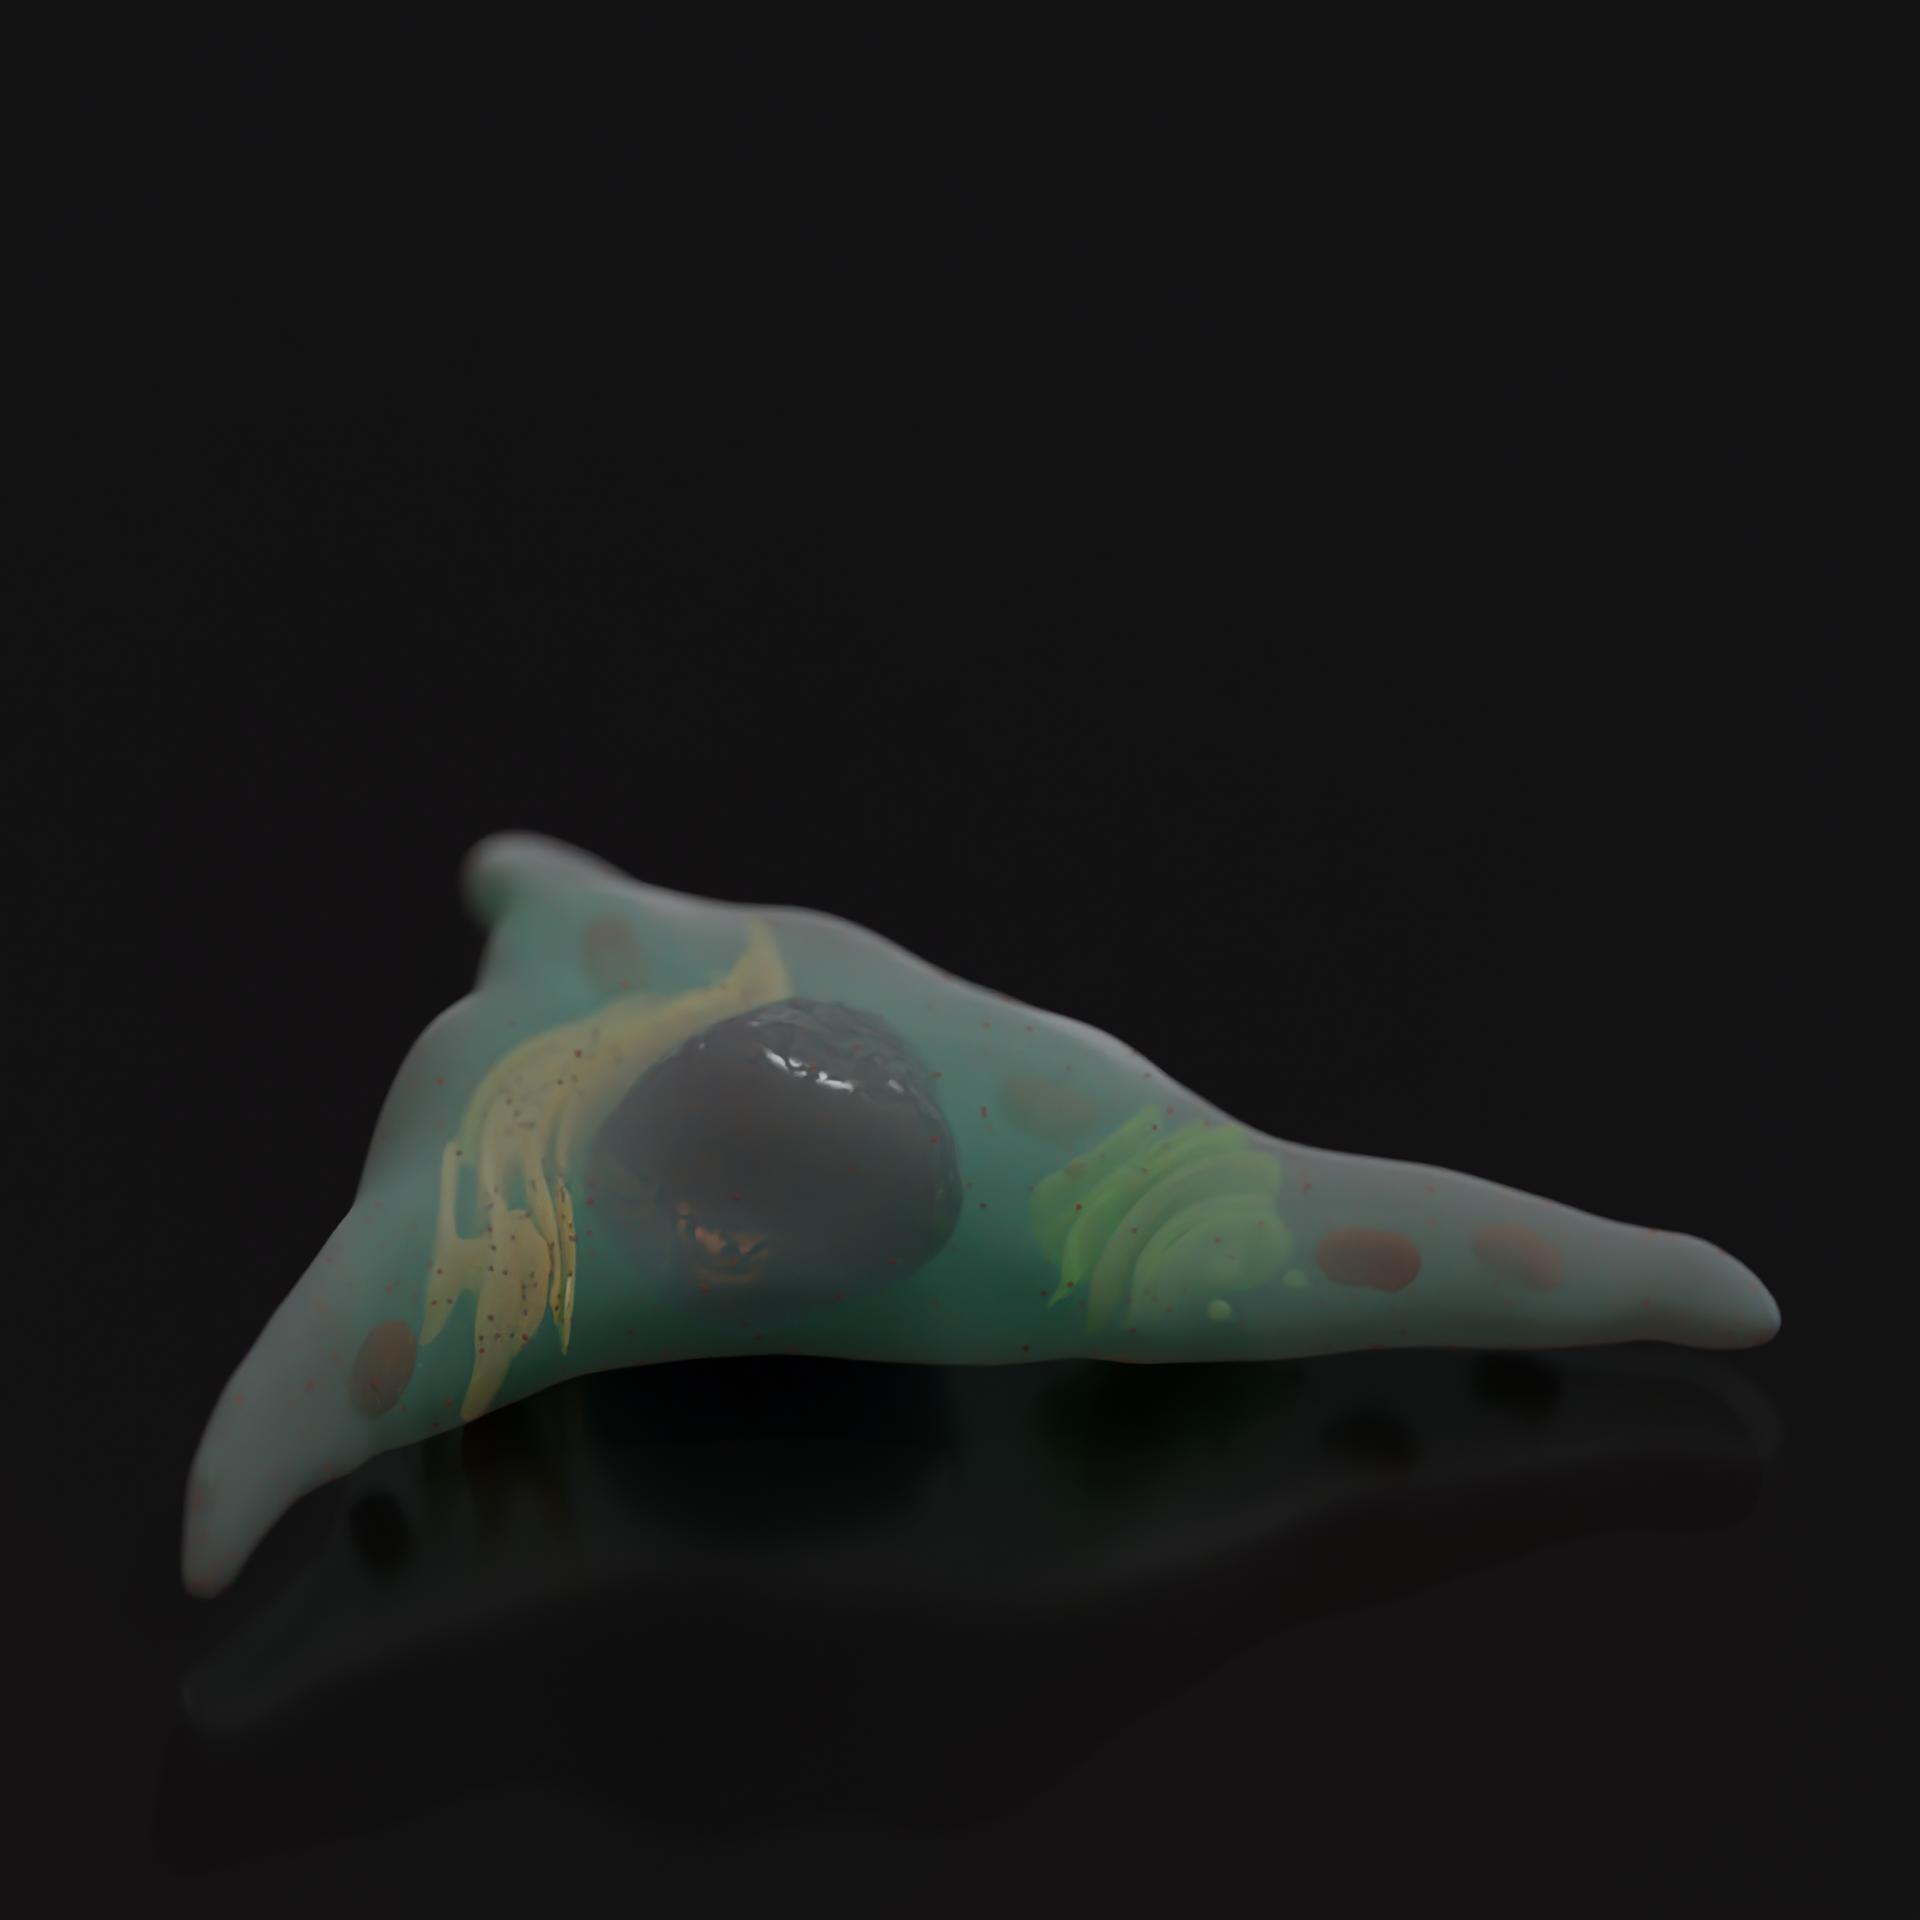
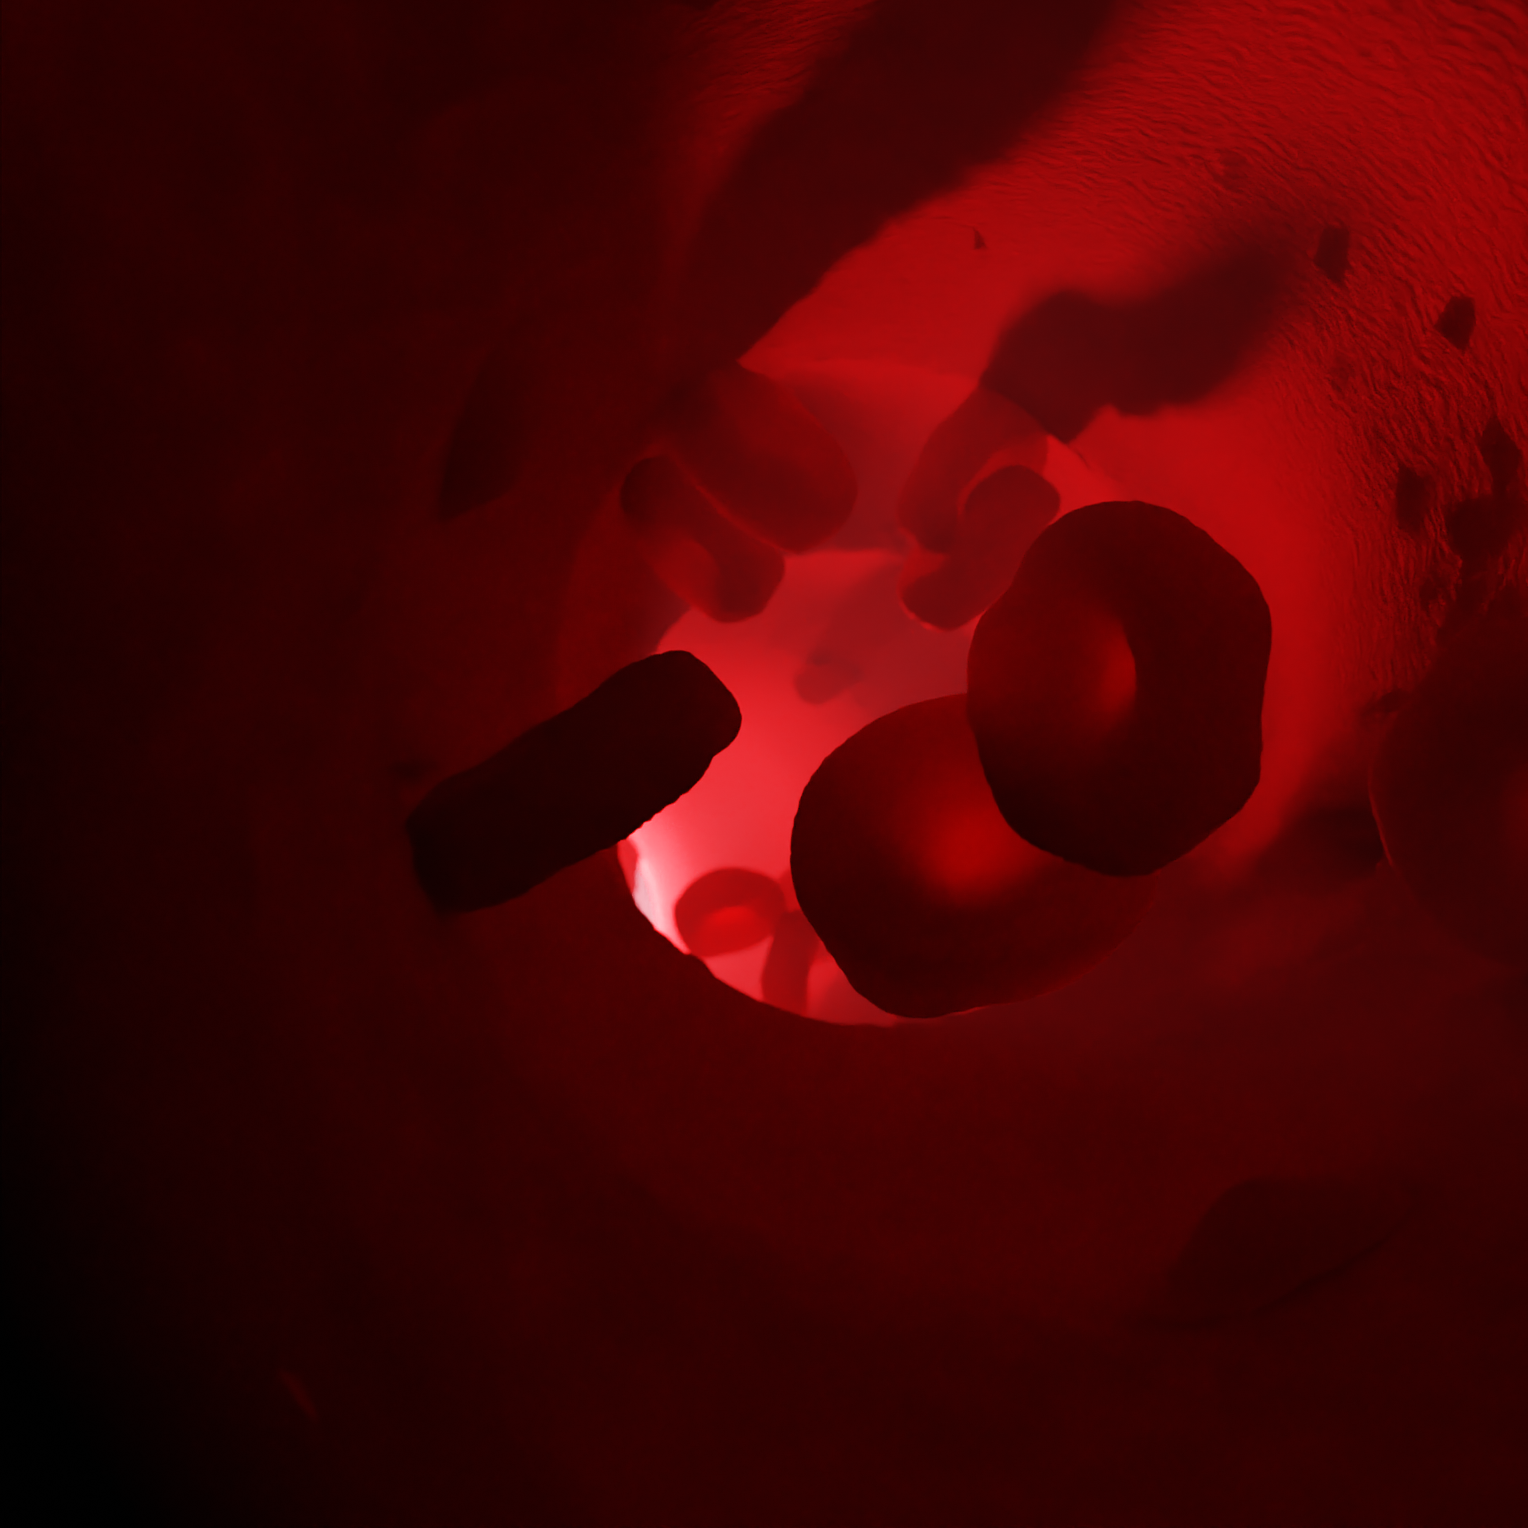
Blender Renders and Covers

Soil Science Projects February to May 2026

As I am transitioning into soil science research, I am working on a number of new portfolio projects.

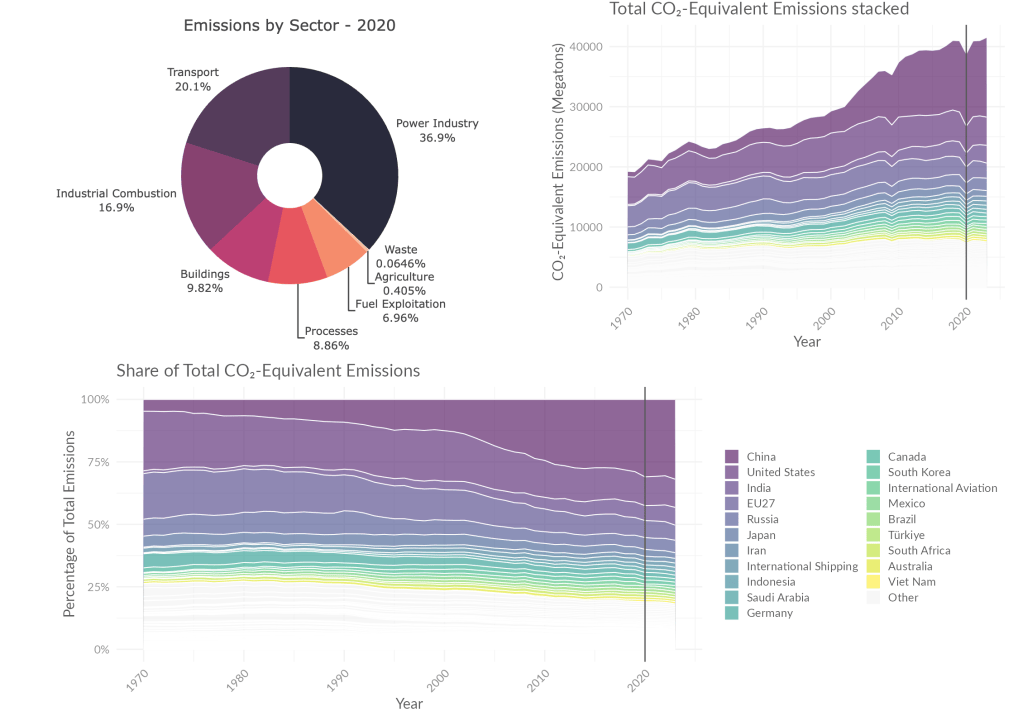
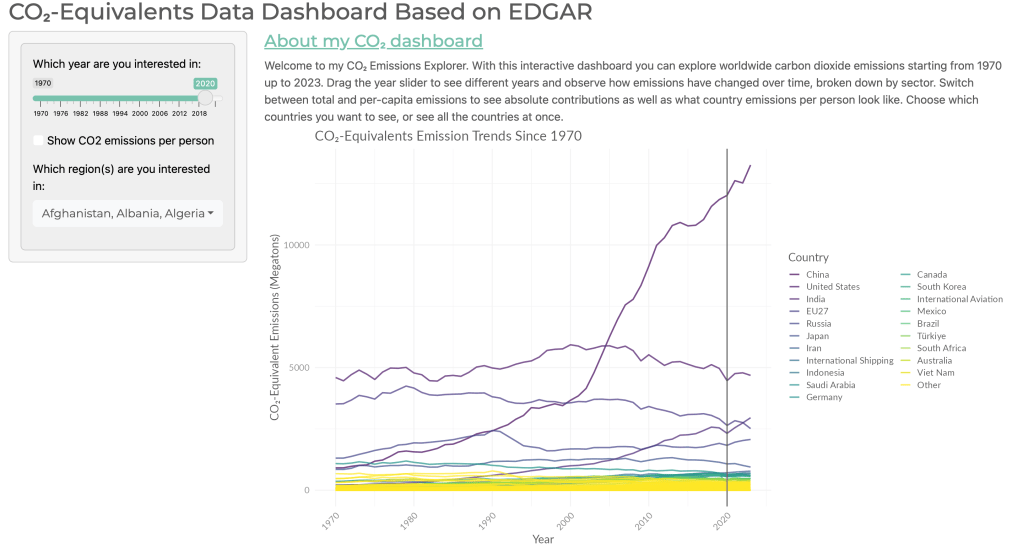
2026 – Interactive CO2 Emissions Dashboard
(built with R Shiny, dplyr, ggplot & plotly)

To start my move into environmental sciences, I started with a visualization of CO2 emissions. I wrote this R Shiny script to enable you to visualize per capita, global, and nationwide emissions until 2023, and analyze them by sector or country of your choice. You can explore the interactive dashboard yourself HERE.

Data Sources: EDGAR – Emissions Database for Global Atmospheric Research
Link to README and documentation on GitHub: https://github.com/vinmk-git/co2-emissions-dashboard

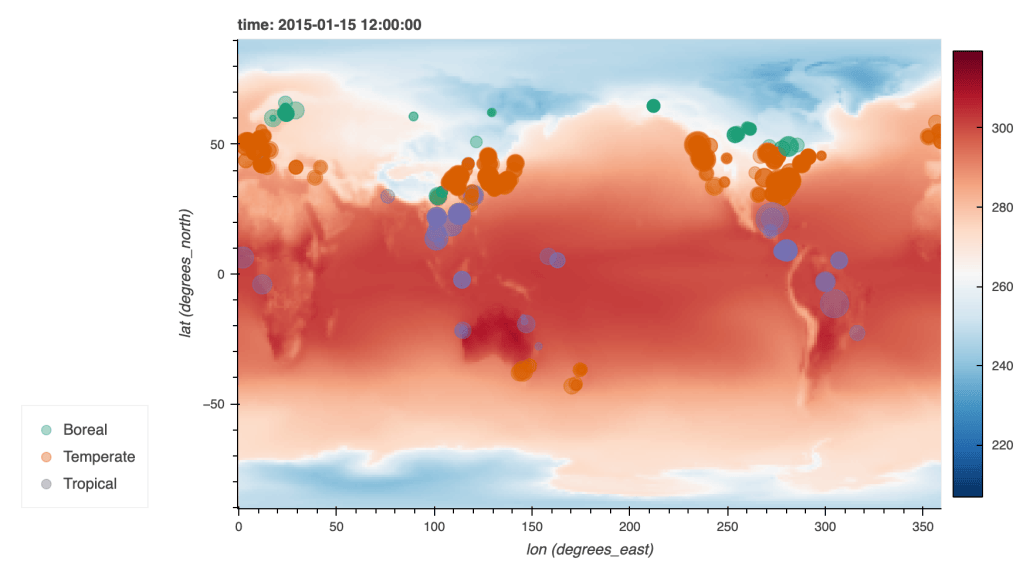
2026 – Soil Respiration Model for Boreal, Temperate, Tropical, and Subtropical Forest
(built with Python pandas, numpy, xarray, scikit-learn, hvplot)

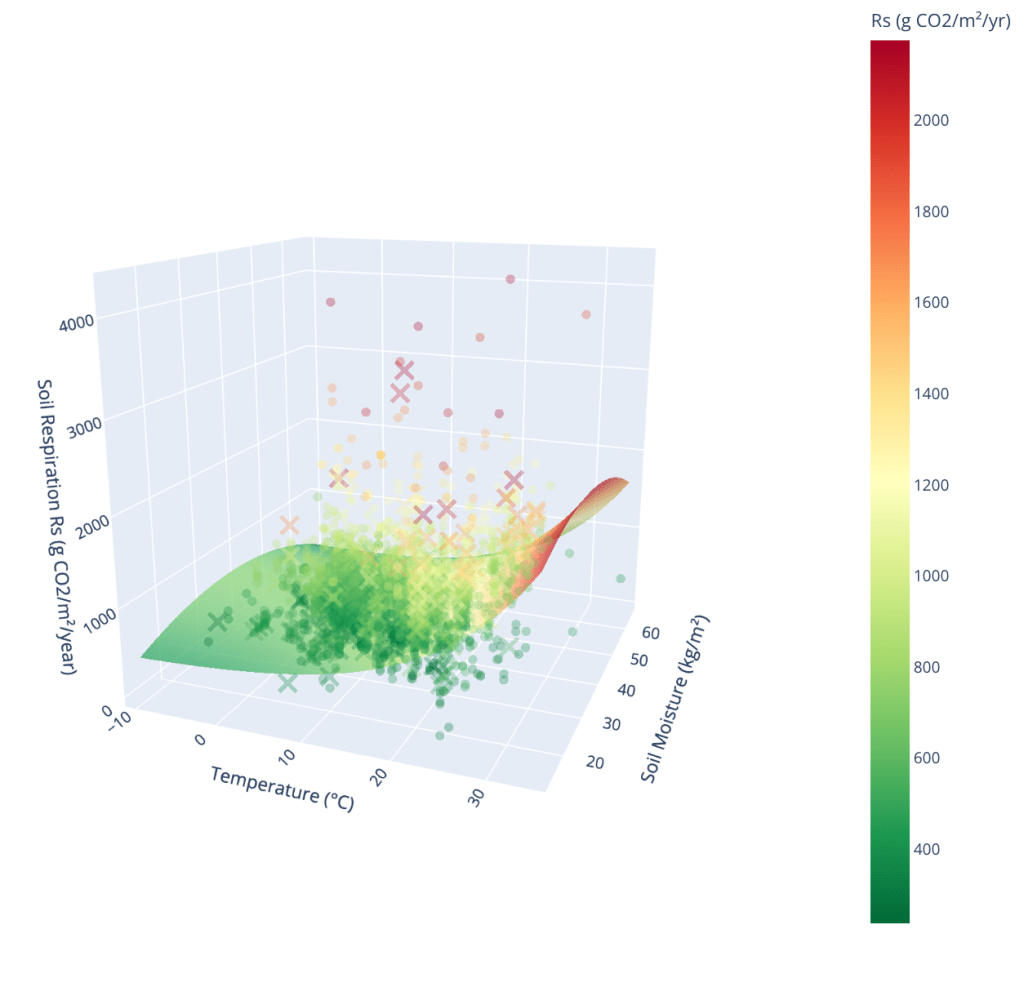
In this project, I am predicting annual soil respiration rates based on IPCC soil moisture and temperature projections (from the Copernicus Climate Data Store). The model is built in Python on historical soil moisture data, as well as the Soil Respiration Database

You can use this fully interactive Google Colab notebook to explore the model yourself!

Data Sources: Copernicus Climate Change Service (C3S) Climate Data Store (CDS) & Soil Respiration Database
Link to README and documentation on GitHub: https://github.com/vinmk-git/Soil-Respiration-Model

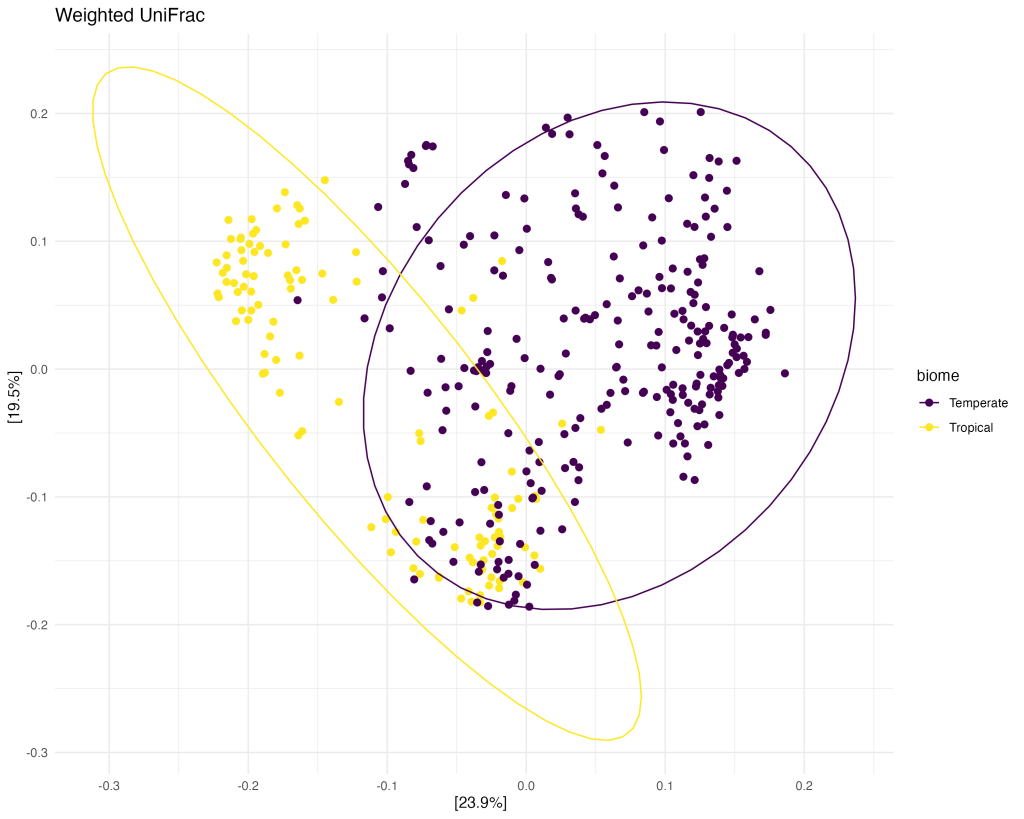
2026 – Bacterial Community Diversity Analysis in Temperate and Tropical Forests based on 16S data
(built with Python pandas, biom-format & R vegan, phyloseq, tidyverse, ggplot, DESeq2 and patchwork)

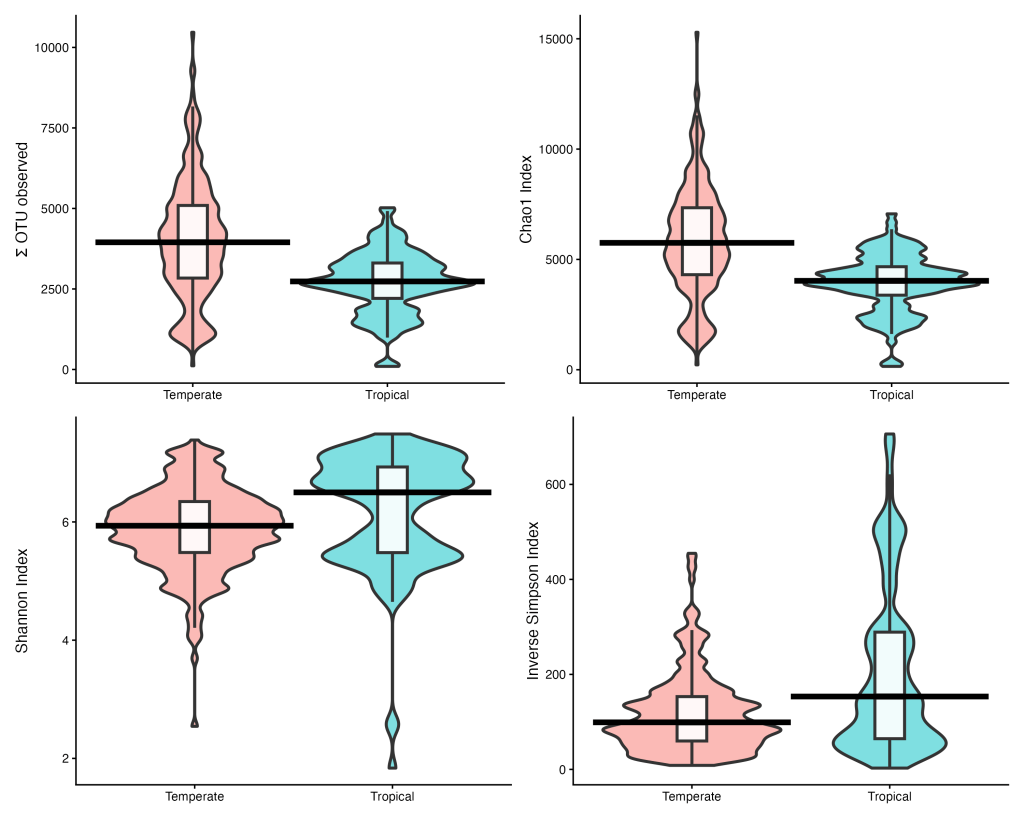
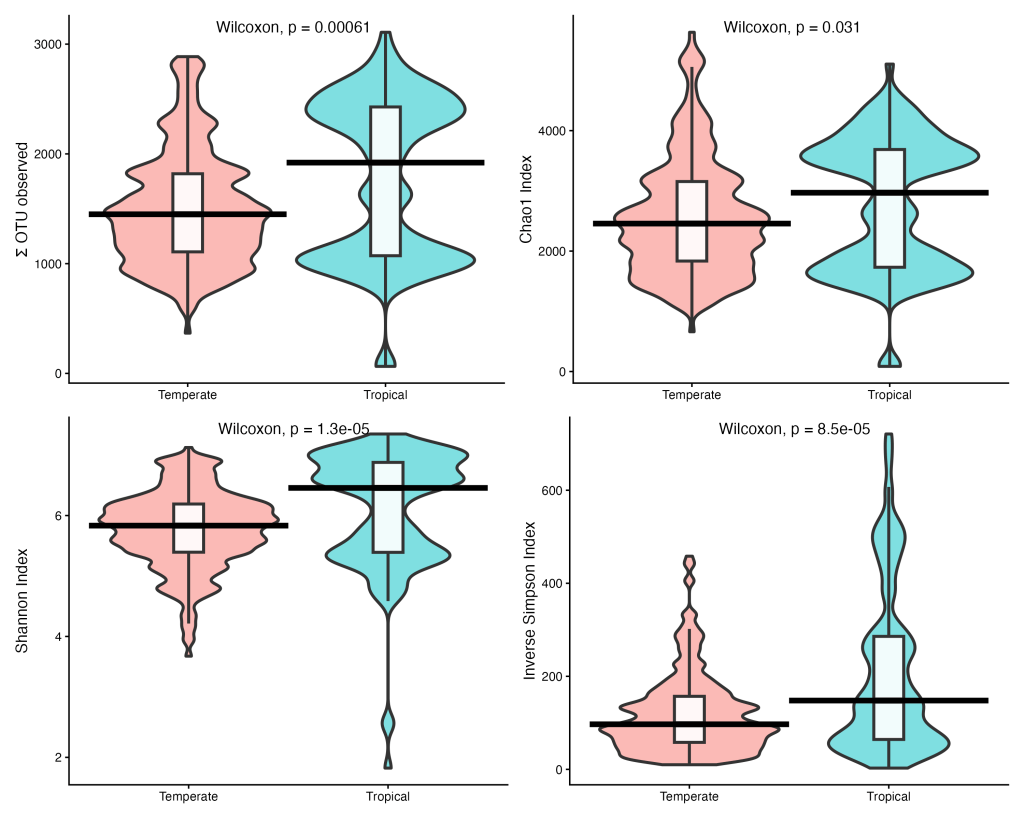
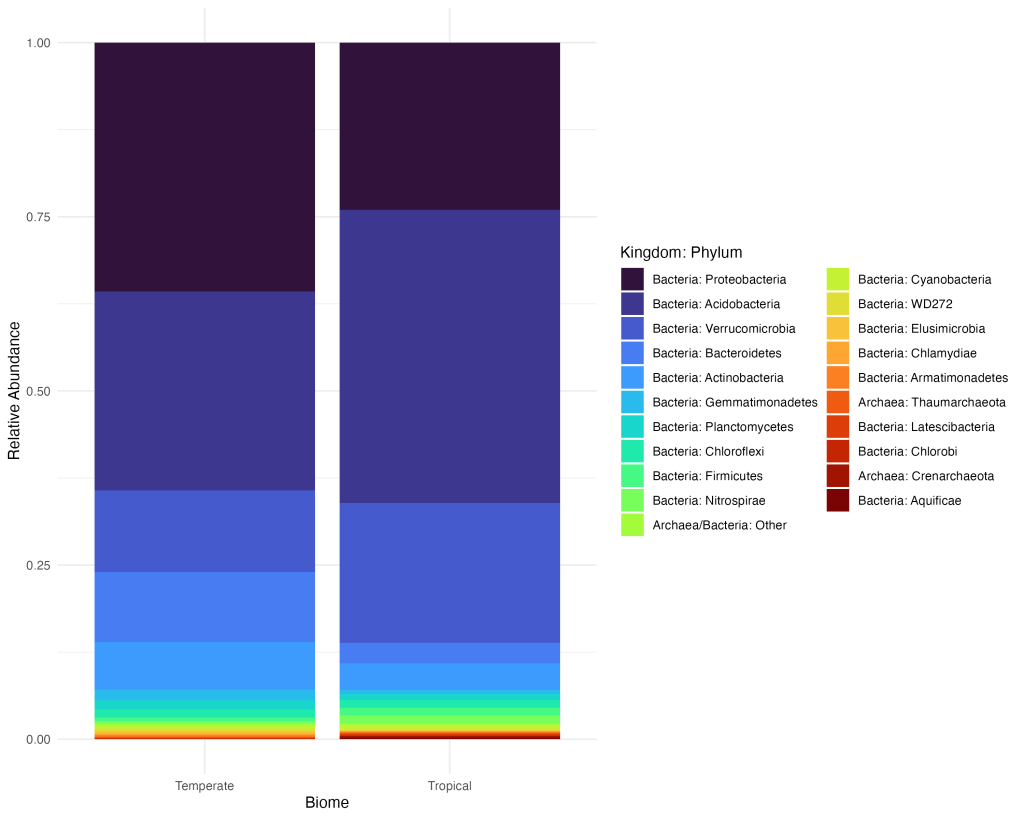
For this project, I analysed publicly available 16S ribosomal RNA (rRNA) sequencing data from the Earth Microbiome Project (EMP). 16S rRNA is found in all bacteria and is therefore commonly used to distinguish different microorganisms. Here, I used the EMP dataset to compare bacterial communities in tropical and temperate forest soils across different diversity metrics. To make the data analysis work, the pipeline spans Python and R and combines Python’s biom-format for data extraction with R’s phyloseq, vegan, and DESeq2 packages for community diversity analysis.

You can check out the code on my GitHub page!

Data Sources: Earth Microbiome Project
Link to GitHub Repository: https://github.com/vinmk-git/forest-microbiomes

2026 – Mycorrhizal Fungi and Plant Growth Meta-Analysis
(built with Python numpy, pandas, geopandas, rasterio, scipy, xarray & R metafor, orchaRd, tidyverse, and ggplot2)

Project 4 of my soil biogeochemistry portfolio is a data pipeline that links published mycorrhizal research to their real-world environmental context – the soil chemistry, texture, temperature, and moisture conditions where those studies actually took place. This is so that I could then analyse how these factors modulate the effects of colonization by mycorrhizal fungi.

The methods and code are available on my GitHub page! The meta-analysis data will be made available soon, as I am currently preparing it for publication.

Data Sources:

DatasetVariablesLink to Dataset
SoilGrids 2.0Nitrogen, sand, silt, clay (0–30 cm depth-weighted), carbon stock (0–30 cm)ISRIC Data Hub
ERA5-LandMonthly mean temperature, volumetric soil waterCopernicus Climate Data Store (CDS)
ESA CCI Land CoverLand cover classification (300m, resampled to ERA5 resolution)Copernicus Climate Data Store (CDS)
RESOLVE Ecoregions 2017
Biome and ecoregion classification
RESOLVE Ecoregions 2017
Global phosphorus dataset
Soil phosphorus forms
NASA Earthdata

Link to GitHub Repository: https://github.com/vinmk-git/meta-analysis-pipeline

Next Up: Plant-Mycorrhiza-Bacteria Agent-Based Systemic Model

This final capstone project weaves together all the different strands that I worked on in projects 1 through 4. Here, I model the plant-microbiome-soil system’s interactions to build an accurate model of how soil carbon, water, nitrogen, and phosphorus are cycled.

More Data Analysis and Figures

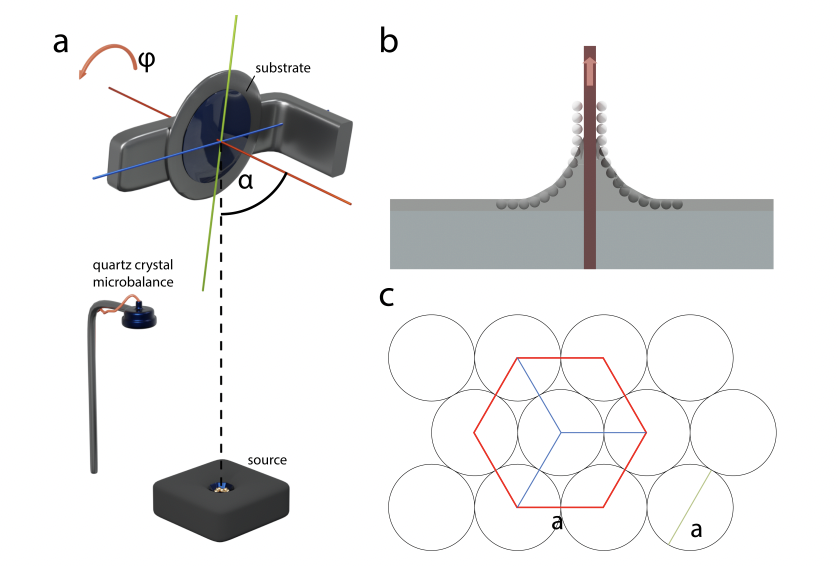
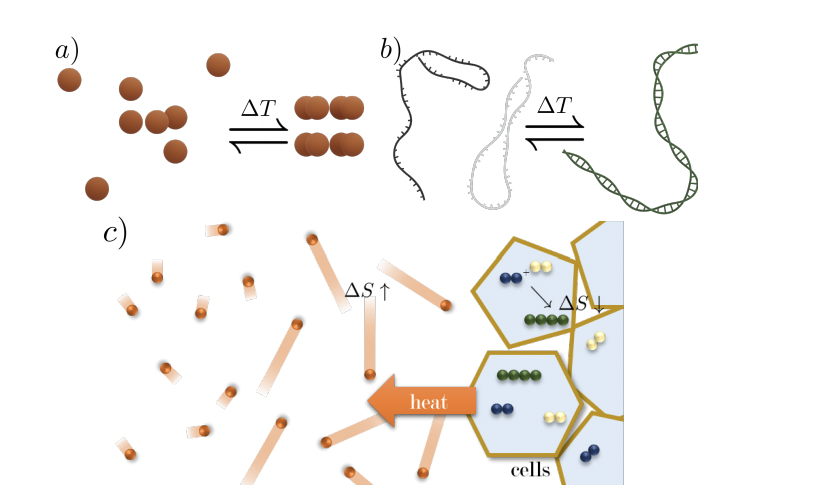
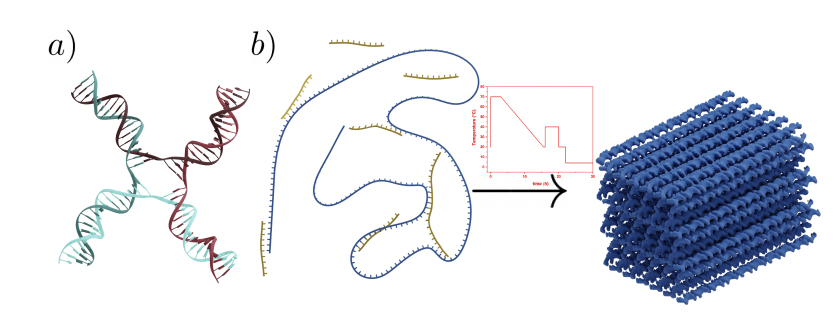
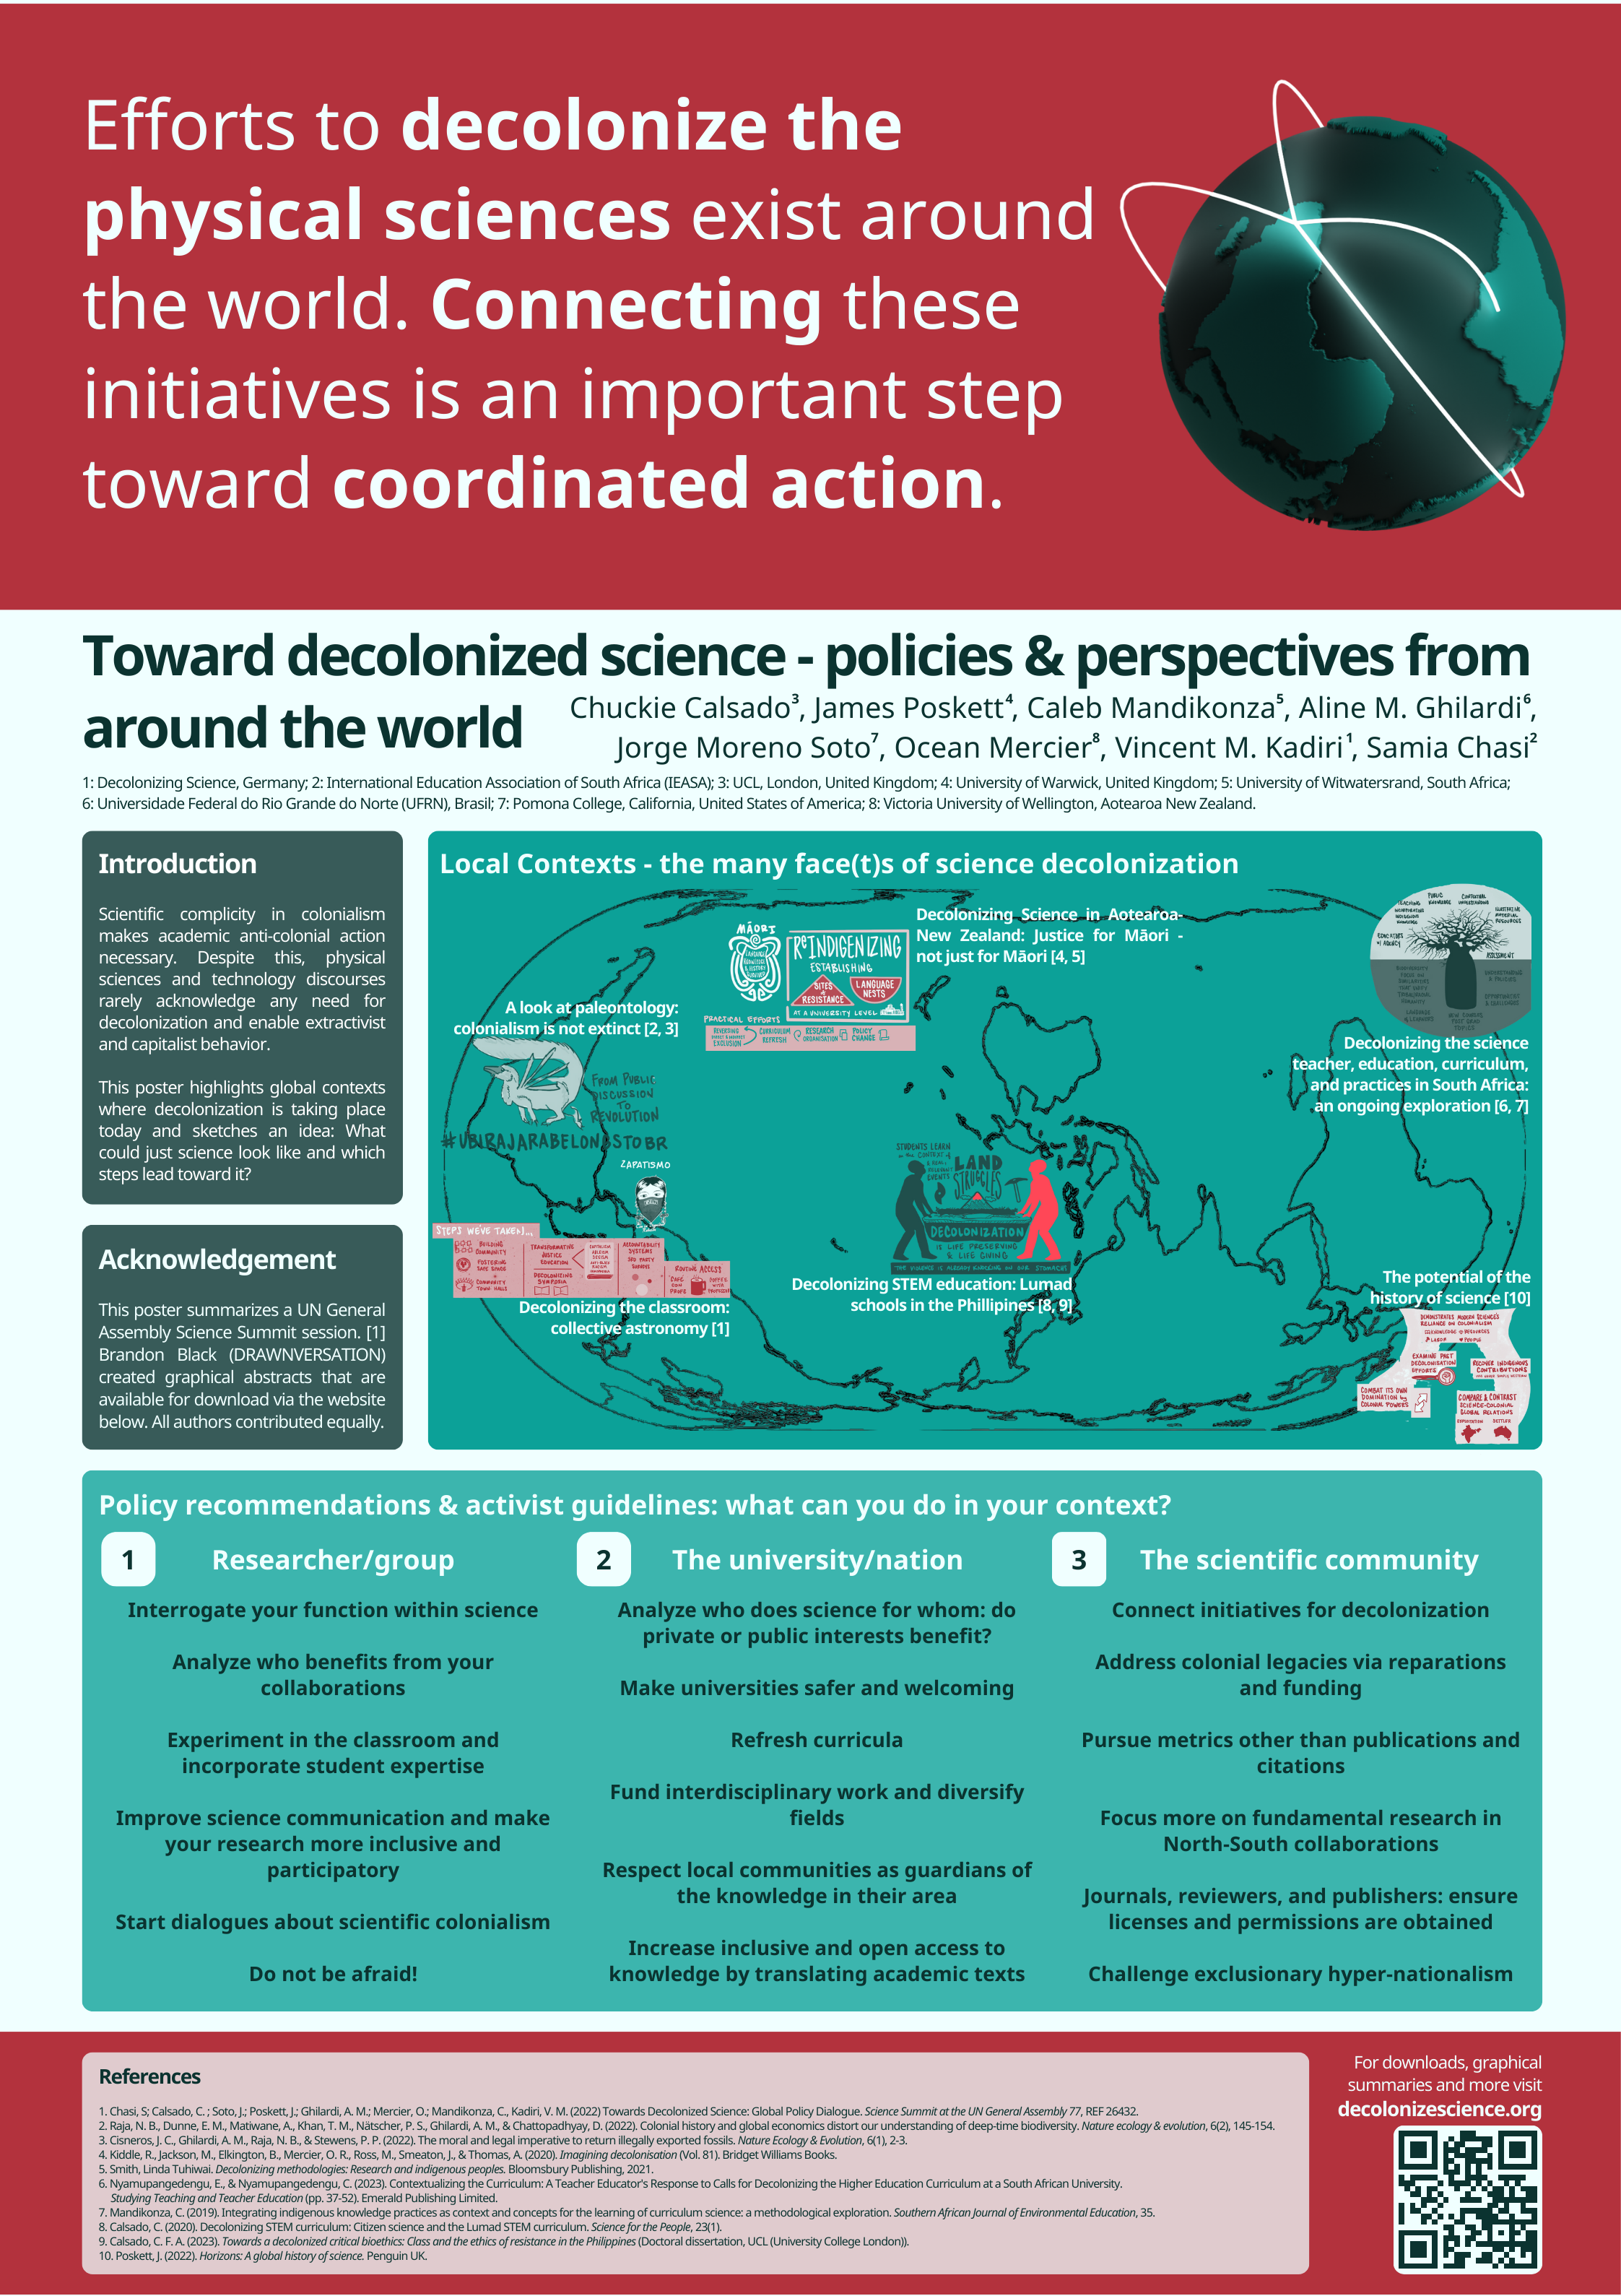
This section shows some of the figures, posters, and illustrations I have worked on in the past.